
This study analysed sectoral trends in the BRSRs submitted for FY 2023-24. Reports from 819 companies across 12 sectors were reviewed—eight from Manufacturing and three from Services (including Construction). Further, some sectors, specifically IT/ITES, Pharmaceuticals, and Textiles, were comparatively more labour-intensive.
Why is BRSR analysis useful to India Inc.
The BRSR (Business Responsibility and Sustainability Report) is a disclosure framework applicable based solely on market capitalisation. This makes it sector-agnostic—helpful for regulatory consistency but challenging for peer comparison. Given its broad scope, companies often need to sift through numerous reports to find data relevant to their material issues. The BRSR Barometer is designed to bridge this gap—offering both sectoral context and longitudinal insight for companies committed to continuous improvement in sustainability. It also equips policymakers with timely, comparable trends across ESG dimensions.
What the data says
GHG Emissions and RE usage
In 5 of the 12 sectors analysed, Scope 1 emissions exceeded Scope 2 emissions. In Power and Metals, Scope 1 emissions constituted over 80% of Scopes 1 & 2 combined but surprisingly, this was lower than the proportions reported last year. Expectedly, Financial Institutions, IT/ITES and Light Manufacturing were at the other end of the spectrum.
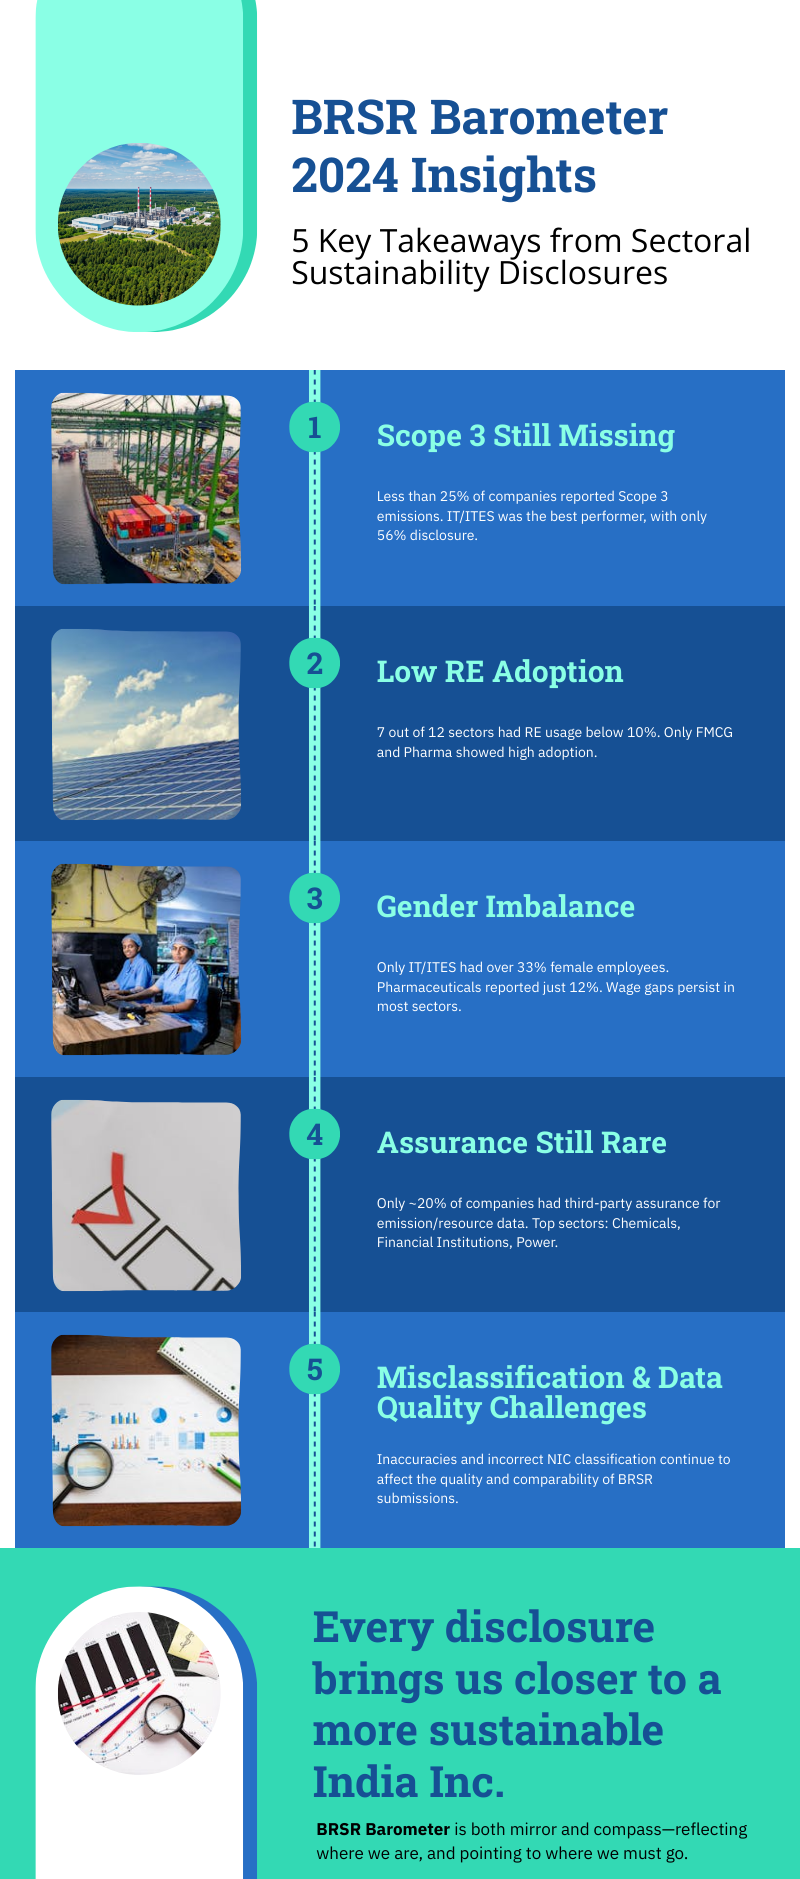
In most sectors, under a quarter of the companies reported Scope 3 emissions. The highest was IT/ITES where only 56% of companies reported. This remains a big concern and it is hard to come to any meaningful conclusions with regards to Scope 3 emissions.
Use of RE was disappointingly below 10% in 7 of the 12 sectors. It was moderate in 3 sectors (IT/ITES, Light Manufacturing and Textiles) but significantly high in FMCG and Pharmaceuticals. Of the 3 sectors that had high Scope 2 emissions where RE could have helped, only IT/ITES and Light Manufacturing showed some intent in switching to renewables.
Energy Consumption
The energy intensity per unit of revenue of two sectors – Power and Textiles – showed exceptional high median energy intensity, above 500 GJ/₹ Cr. The next four – Chemicals, FMCG, Metals and Pharmaceuticals – were more modest, ranging. The remaining 6 were in double digits.
Water Consumption
Measured in terms of KL/₹ Cr., Power and Textiles sectors were, expectedly, very high consumers. At the other end of the spectrum where sectors such as Financial Institutions and IT/ITES and Trade which were low consumers. This was quite similar to the 2022-23 numbers.
Solid Waste
Expectedly, Metals had the highest solid waste intensity followed by Chemicals, Heavy Manufacturing, Pharmaceuticals and Textiles, while the other 7 sectors were low. What was surprising to note was that compared to the previous, Construction and Power reported moderate waste intensity. The latter may be explained by the fact that the sector had a significant number of non-coal based power producers reporting and hence less fly ash production.
The bulk of the waste generated was non-hazardous, though some sectors such as Chemicals, Construction and Pharmaceuticals reported a significant proportion of hazardous waste. It is not clear how e-waste of the IT/ITES sector has been reported because the intensity is rather low, which was the case last year too.
Social Indicators
Gender Equity
The headline is that employment of women in Indian industry is quite low, more so in the manufacturing space. Only IT/ITES had over a third of the workforce. In another 2 sectors – Financial Institutions and Textiles – it was just over a fifth. In Pharmaceuticals, one of the 3 relatively high labour-intensive sectors, it was only 12%. Construction employed only 3% women and while this is counter-intuitive, it can be explained by the fact that most women are employed through contractors.
Wage disparity between women and men was quite significant too. In 8 of the 12 sectors, women were paid 90% or less of their male counterparts and in IT/ITES and Textiles, this was 75% or under! Exceptions were Chemicals, Construction, FMCG and Pharmaceuticals.
On the issue of women’s safety, the numbers were surprising. In the 3 sectors where women’s employment exceeded 20%, the number of complaints per 1000 women employment was low, suggesting either low reporting or high effectiveness of safety measures. On the other hand, complaints were the highest in Chemicals and Construction sectors where women’s employment was 6% and 3% respectively.
Safety
Fatalities in some sectors were higher in 2023-24 compared to 2022-23. As many as 7 sectors reported more than 25 fatalities in the year of which in 3 sectors – Construction, Financial Institutions and Metals – the number exceeded 50! The surprise was, undoubtedly, Financial Institutions and needs to be looked into.
In terms of reported injuries to total employment in the sector, the trend was similar to last year. However, the surprises were Textiles (high on this metric but low on fatalities) and Financial Institutions (low on this metric but high on fatalities). FMCG injuries continue to be high.
Governance
Though not yet required by BRSR, only about 20% of the reporting companies got their emission and resource consumption data independently assured. Some exceptions were the Chemicals, Financial Institutions and Power where this was closer to 40%.
Investment in sustainability, measured by proportion of R&D and Capex expenditures to total, also showed sectoral variations. R&D expenditures were largely between 25 and 30% with outliers like Power (1%) and Financial Institutions (11%) bringing up the rear while Textiles (45%) and Metals (68%) were at the higher end. Capex expenditure percentages were largely in single digits with exceptions such as Power (54%) and Construction (25%).
Challenges
Inconsistencies and inaccuracies in data being reported remains a challenge, both in terms of omissions and in terms of quality of data. This has resulted in a lot of work required behind the scenes to clean up the data and make it conducive for analysis.
Another challenge is the 5-digit National Industries Classification (NIC) that companies are expected to classify themselves in the BRSR. There are several cases where misclassification has been seen which impacts the accuracy of the sectoral analysis.
Conclusion
As sustainability disclosures mature in India, the BRSR Barometer offers a valuable lens to assess where sectors stand—and where they can go. While the data reveals persistent challenges around consistency, completeness, and sectoral comparability, it also points to clear areas of progress and leadership.
For companies committed to long-term value creation, this analysis reinforces the importance of meaningful, transparent reporting. As reporting quality improves and sectoral benchmarks strengthen, the BRSR has the potential to become a strategic asset—serving both as a mirror for self-reflection and a window into a more sustainable future for India Inc.
Download the report from EarthInherited.com

Shankar Venkateswaran is the Co-Founder and Managing Partner-Sustainability Integration at ECube Investment Advisors Pvt. Ltd.

Tarun Durga is the Chief Design Officer at ECube Investment Advisors Pvt. Ltd.


